The ongoing crisis in Syria has captured – and broken – our hearts here at Resource Media. As communicators, we are well aware that this is a story where aid organizations are fighting their own battle battle – “compassion fatigue” – in the hearts and minds of Americans, rather than the streets of Aleppo. This is a story that requires journalism, whether it be by traditional media or NGO-based storytelling, that gets at the big-big picture view, not just the tragedy happening in Aleppo, in addition to the underlying causes of the Syrian refugee crisis, systemic failures that need to be addressed and other issues that go beyond Syrian government or rebel gains in the day-by-day fighting. And to be successful, this storytelling needs to take a final step of connecting the motivated readers with aid groups should they be so moved to act on this humanitarian crisis.
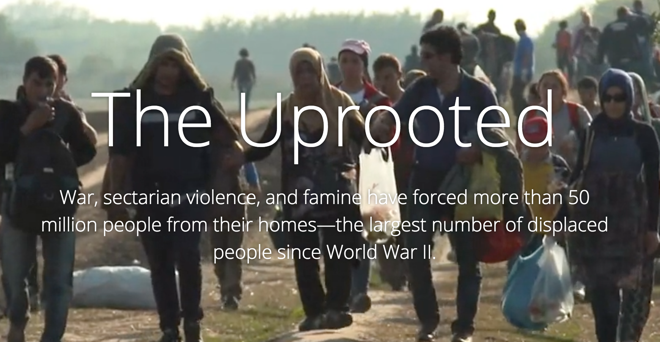
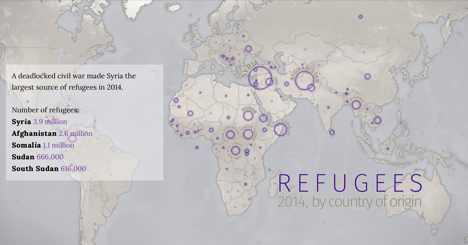
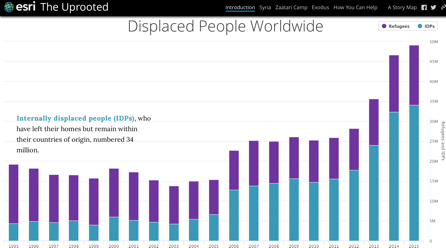
Along comes Esri Story Maps, which allows organizations to tell a more in-depth story, combining maps with text, images and other multi-media content. We were so impressed with how a partnership of multiple organizations explained the Syrian crisis to lay audience – from underlying causes to solutions – in a visually compelling, informative and powerful way — with the story called The Uprooted. Consider this a Resource Media staff pick for one of the best NGO storytelling projects of 2016!
The art of storytelling is continually being reshaped in our ever-more digitally-based culture. Today, organizations are capturing and telling their stories through the traditional text medium, but also integrating photos, videos, audio, infographics, and even satellite maps. The result is more engaged audiences, even with longer-form storytelling.
Esri is one of a growing number of online storytelling tools used by nonprofits and businesses alike. The list includes Medium, Exposure, and others. The software in each of these platforms allows users to create easily comprehensible and linear story lines. They also provide templates that allow you to incorporate your own video, photo, and social media links. Esri uses ArcGIS technology, which allows users to create interactive maps from datasets already in the program, such as census and environmental data, or your own data uploaded to the site. Esri offers a nonprofit license, and those who qualify receive the majority of the services free of charge.
Here are a few tips for success as you go about creating multimedia stories on your issues:
- Zoom in on an individual person, place, or event. Use this smaller, often more accessible, story lens to communicate your broader work.
- Embrace the format of these online storytelling tools which often force you to insert visuals, such as photos, maps, infographics, or charts after every paragraph or two of text.
- Be careful to not overcrowd a storyboard. More than 2-3 visuals seen by the viewer on one screen, typically overlaid with each other, can be confusing.
- And, finally, your fabulous story needs an audience! Develop your distribution plan before you dive into story creation. Incorporating your story into a social media campaign is one of the most effective ways to distribute online stories.
Happy storytelling!
— Lizzy Ehren, former intern