With somewhere in the neighborhood of 1 billion worldwide users, Facebook is a great way for nonprofits to connect with people they know (and people they don’t know, yet) and spread the word about their good work. And thanks to Facebook’s new and improved Insights, it’s easier than ever to measure engagement and learn what gets your community jazzed.
The new dashboard is divided into four main sections: Overview, Page, Posts, and People. Here’s how to get the most out of each.
Overview
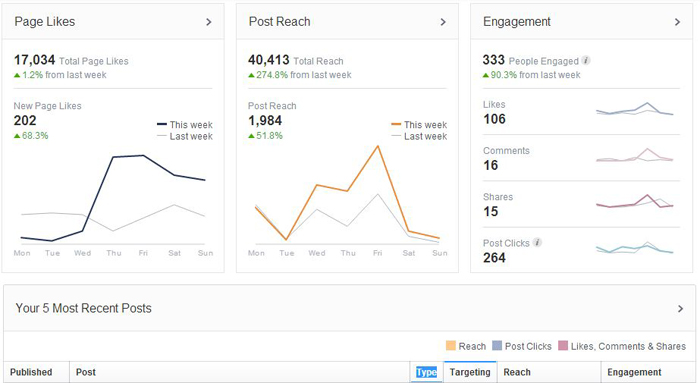
This section delivers a 7-day snapshot of your page’s performance. You get some of Facebook’s key metrics – Likes, Reach, and Engagement – just like before, and you also get a quick peek at your five most recent posts with more detailed stats like Reach, Post Clicks, Likes, Comments, and Shares. The new layout is cleaner and easier to navigate, but the data delivered here is largely the same as the old Insights.
Page
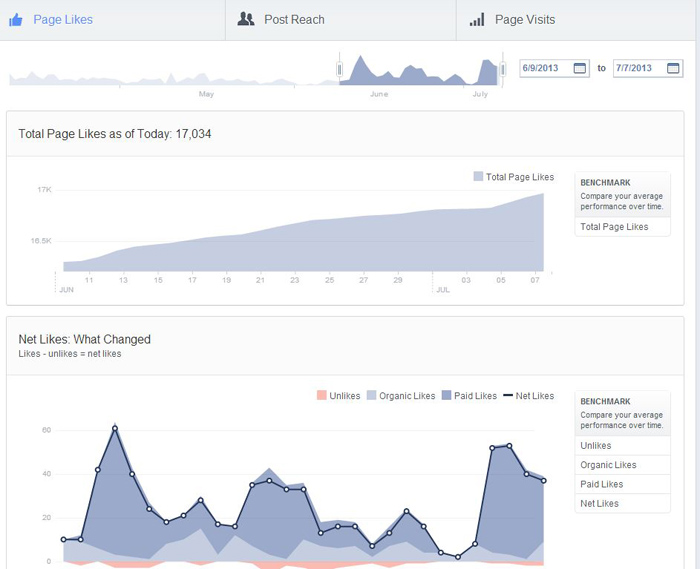
The Page section is where you’ll find lots of good info about how your fan base has grown and how your fans are connecting with your page. There are three tabs: Page Likes, Post Reach, and Page Visits.
- Page Likes: Information about the users who Like your page. Simpler graphics and better visualizations have replaced the variety of bars, lines, and lists at the old Insights, and you can actually see your Page’s Likes over time in a tidy graph. More data is available for where your likes came from – now called Net Likes – and, perhaps best of all, you now have the option to compare the data you’re looking at to your average performance over time. This benchmarking capability is one of the highlights of the new Insights and you’ll see it again and again – and that’s a good thing.
- Post Reach: Deep-digging data for your content’s reach. Features like Overall Reach and Engagement Actions will be familiar to you, though, again, the new layout makes them easier to interpret. The big difference here is Engagement Actions that Influence Reach and Negative Engagements, which includes actions like Hide, Report as Spam, and Unlikes. This is a handy (if sort of depressing) set of data which can really help you drill down into why you may have seen your page’s Reach dip without (much) warning. No more speculation necessary: Your page’s Reach should be easier to track now. And, again, you can more easily benchmark this data to compare to your page’s past track record.
- Page Visits: A helpful set of data that shows you what sections of your page get viewed the most, which is great to know especially if you’re running a photo content or something like an ActionSprout campaign. This section also includes Other Page activity, which tracks Mentions, Posts by Other People and Checkins. You also get a graph that shows the number of times visitors came to your page from outside of Facebook, which is really useful when it comes to determining who is using your page and how they’re getting there.
Posts
Once you’ve absorbed everything about your page as a whole, you can drill down into what sort of action your individual posts are generating. Facebook previously included this data in the Overview section, and breaking it out on its own gives it more space to breathe and is a huge improvement. If you’re the type of Facebook admin who checks your page’s performance each day, get used to the Posts section. You’re going to be spending a lot of quality time together. Each section has good stuff waiting for you:
- All Posts: Breaks down each of your page’s posts by data points that are easier to understand than in the previous version: Reach, Post Clicks, and Engagement. You can more easily sort your data and posts by whatever metric you need: Date published, post title, post type, reach, etc.
- When Your Fans Are Online: Yep, you can now see, in a tidy graph, when your fans tend to be online and available to interact with your content. No more guessing about what time of day is best to post, and another huge improvement.
- Best Posts Types: Do photo posts perform better? You can now easily tell which types of posts are doing the most heavy lifting with the data here, where you’ll see averages (more benchmarking! Hurray!) for reach and engagement.
People
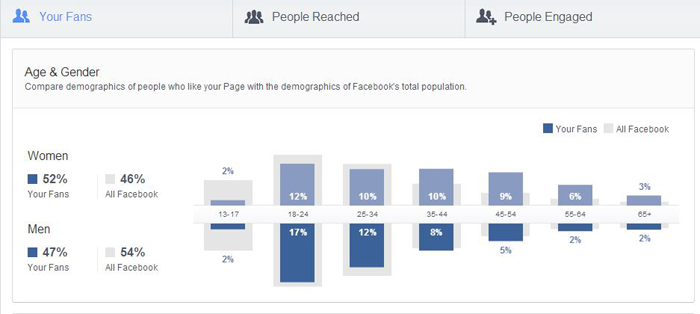
This is a new section that aggregates a variety of data, some of which used to be included elsewhere, and some that is brand new. This is where you come when you want demographic info, and, for the first time, that includes data from all of Facebook’s users, so you can see how your demographics compare to everyone else using the platform. It has three sections: Your Fans; People Reached; and People Engaged.
- Your Fans: You’ll recognize a lot of this from the previous Insights’ demographics data, including data points like Age, Gender, Location, etc.
- People Reached: A very nice new visualization of the demographics of the people who saw your content, compared to your Fan base as a whole.
- People Engaged: More drilled-down data goodness here, with demographic data of the people who engaged with your posts compared to those who didn’t. This will be incredibly useful information as you continue to craft your Facebook content strategy.
All in all, this is an improvement over the previous versions of Insights, which didn’t dive as deep and left a lot of the dot-connecting up to you. You can see many of Facebook’s key performance metrics with fewer clicks and better visualization;
you can do a ton of benchmarking and comparison, both to within your own community and to Facebook as a whole; and you can more easily see who is engaging with your content, including when they’re most likely to do so. There’s a lot to see and do, but by getting to know the new Insights, you’ll be better measuring your actions and getting the most out of the platform.
Have you been using the new Insights? What do you think of it? Let us know in the comments below!


