Download your own copy of this tipsheet here.
Why infogr.am?
Have you ever seen a great infographic on social media and wished you could make one for you own organization? Well, now you can. Infogr.am, an online infographic generator, makes it easy to express your data in a visually captivating way.
Infographics are a powerful tool for communicating important information. They are also likely to get shared and liked on social media. Infogr.am can automatically translate your spreadsheets into simple but appealing charts and images.
Here’s how:
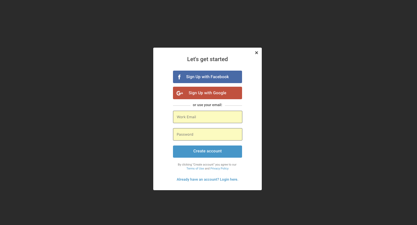
- Make an account
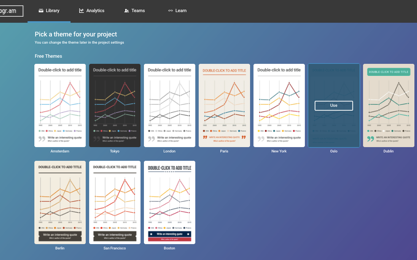
- Create a project
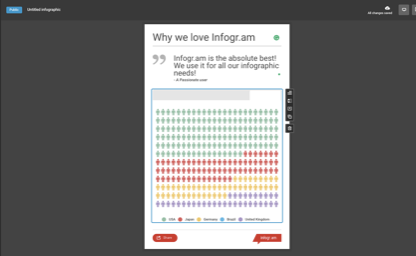
- Enter your data
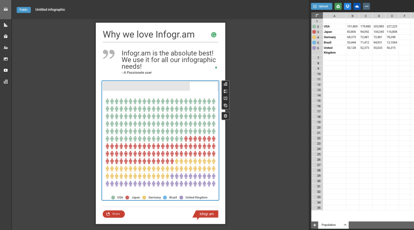
- Add the finishing touches
Infogr.am has three levels of membership: Free, Pro, Business and Enterprise. As you go up each level you gain access to more features and options. However, if you are new to the program, the basic free membership gives you a lot of great tools to start. All you need is an email address to create an account.
When you begin a new project, Infogr.am gives you the choice of starting with a single chart or a larger infographic containing multiple charts. If you select the latter, you can pick between multiple design themes, and add charts, text, images, maps and video to your graphic.
Once you select a template, you are ready to enter your data and make your graphics. From the right-hand menu choose the type of chart you want to add to your graphic. Once selected, double click the chart to bring up a corresponding spreadsheet. You can enter data directly into or upload an existing spreadsheet. From this menu you can also adjust the visual elements of your chart. When you are finished, click the ‘Done’ button.
Once all of your charts are complete, go through your graphic and make sure it feels cohesive and clear. Add titles, labels, and captions where appropriate. Consider including quotes that support your data and adjusting the color scheme to reflect your organization’s colors. When you are finished you can publish your graphic on Facebook, Twitter or Pinterest. If you upgrade to a paid account you can download your graphic directly. That’s it!
Happy ‘gramming!
Download your own copy of this tipsheet here.